Clik here to view.

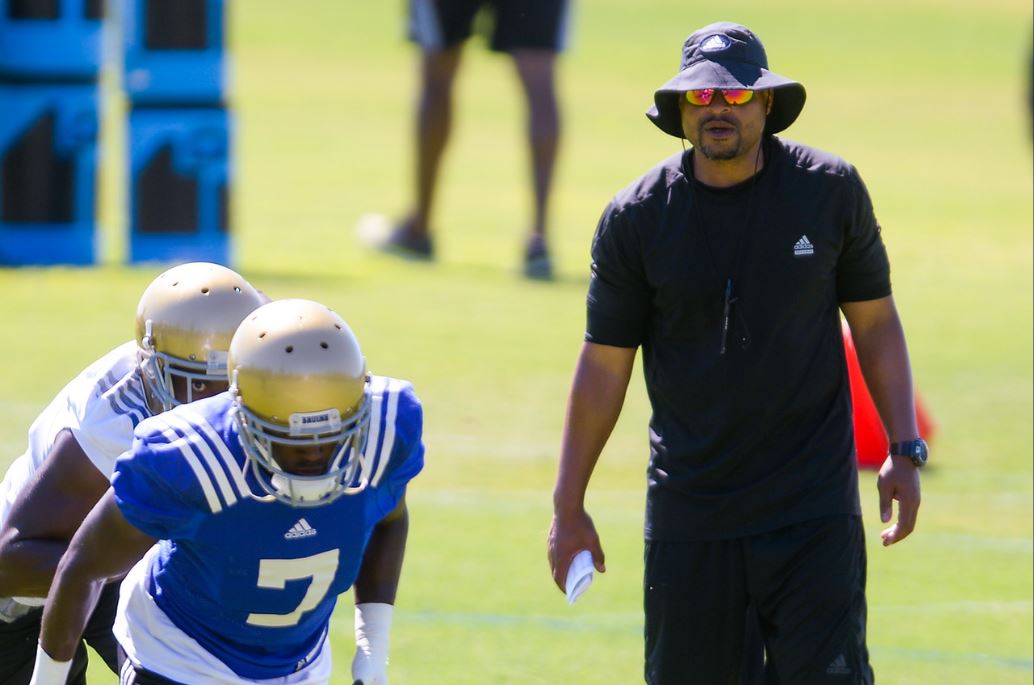
Defensive backs coach Demetrice Martin leads one of the strongest units on the UCLA defense. Photo by Rachel Luna/San Bernardino Sun, SCNG
UCLA is hoping to take the next step on defense heading into the third year with defensive coordinator Tom Bradley, but how has the unit progressed under the coach’s watch during the past two years?
Here are three charts to showing how the UCLA defense has performed since Bradley took over for Jeff Ulbrich in 2015.
SCORING DEFENSE
Bradley is known for a “bend but don’t break” attitude when it comes to defense. The only stat he’s interested in is points. Between 2004 and 2009, Penn State never finished lower than 10th nationally in scoring defense with Bradley as its defensive coordinator.
In that regard, the Bruins have been slightly better under Bradley than during the last year of the Ulbrich era. In 2015, points allowed per game dropped by 2.1 from 2014, but rose again in 2016. UCLA’s 27.5 points allowed per game in 2016 was seventh in the Pac-12.
The defense was on pace for an excellent year through seven games, surrendering only 20.3 points per game before the injury to Josh Rosen resulted in a change in offensive philosophy that correlated with a quick decrease in defensive success. In the final five games of 2016, UCLA allowed 33.6 points per game.
Here’s how teams scored against UCLA during the past three years (2014 being the last under Ulbrich, and 2015 and 2016 under Bradley). The “other” category includes defensive and special teams touchdowns.
Image may be NSFW.
Clik here to view.
The 2016 point total is lower than those of 2015 and 2014 because UCLA only played 12 games after missing a bowl game with a 4-8 record.
While the points per game allowed went back up in 2016, the percentage of points allowed on offensive touchdowns has decreased each year under Bradley. In 2014, opponents scored 67.4 percent of their points on rushing or passing touchdowns. In Bradley’s first year, that rate decreased to 62.1 then dropped to 60 percent in 2016. That follows with the coach’s bend-don’t-break philosophy.
TOTAL DEFENSE
Although he doesn’t subscribe to the importance of yards allowed, Bradley has found success in that metric during the past two years. Here is a breakdown of how teams move the ball against the Bruins:
Image may be NSFW.
Clik here to view.
Opponents’ yards per play have decreased each of the past two years. Last season, teams gained 4.85 yards per play, UCLA’s lowest average for a season since 2007, and the second-best mark in the Pac-12, behind Washington’s 4.61.
UCLA’s run defense was poor in 2015, the first year under Bradley, but improved significantly in 2016 when the Bruins allowed 26.8 fewer rushing yards per game. Last year, Bradley was able to implement his preferred 4-3 scheme, which helped the team improve against the run.
The Bruins have consistently improved in the air during the past two years. UCLA went from third to first in the Pac-12 in pass defense efficiency in 2015, then continued that success in 2016. Last season, the unit led the conference in passing touchdowns allowed with 12, the fewest allowed by a UCLA team in a season since 2001. The Bruins are allowing fewer touchdowns and grabbing more interceptions, two very positive trends for the defense.
